ToxiVerse tutorial
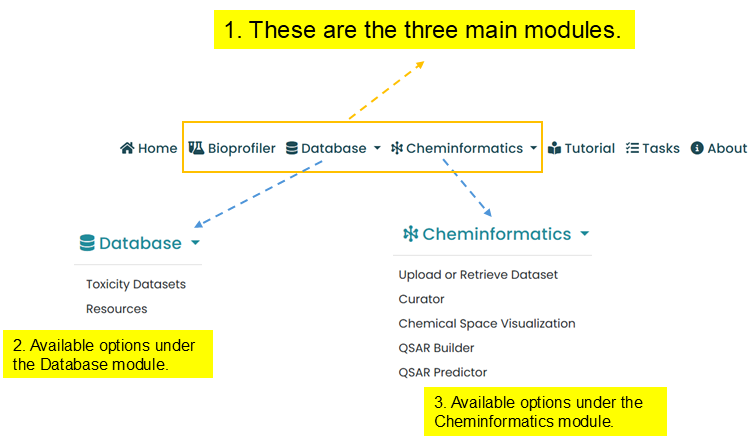
This page provides a step-by-step process for using all three modules of ToxiVerse. Please scroll below for the contents.
Introduction
Computational toxicology plays a significant role in identifying hazardous compounds to protect human health and the environment in a cost-effective manner. A major challenge in this field is the lack of publicly available and user-friendly computational tools that can be used for chemical risk assessment with a user-provided dataset, especially by users with limited computational expertise.
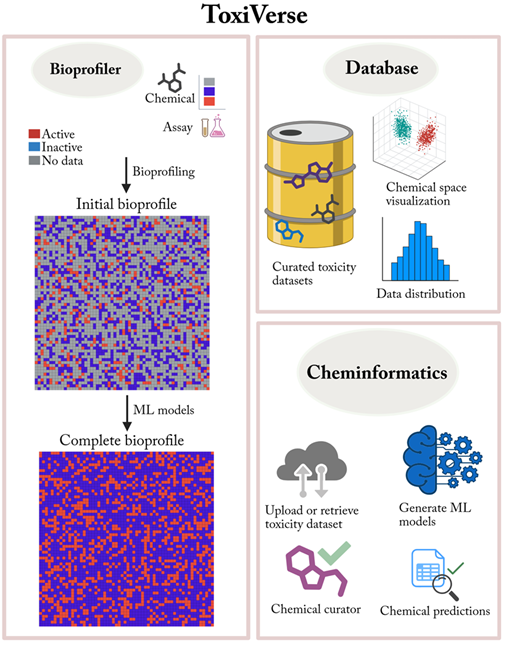
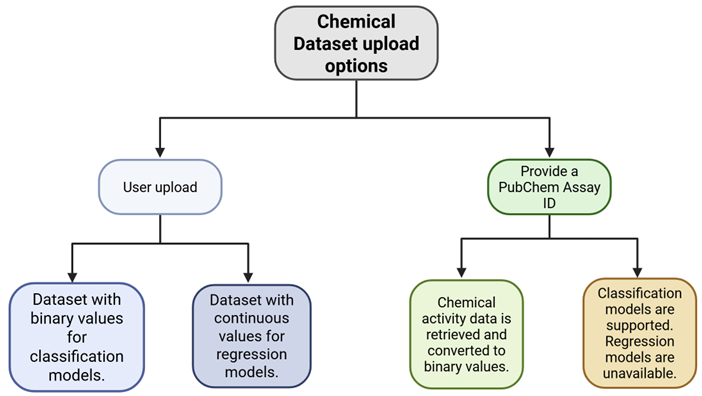
To address this need, we developed Toxicology Universe (ToxiVerse), a web portal designed to assist toxicologists, pharmaceutical researchers, and chemists in assessing chemical safety. Please check the figure below for the available options.
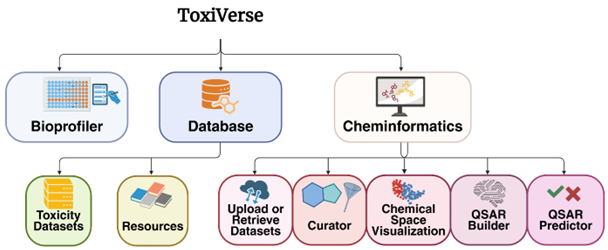
ToxiVerse offers the following modules:
- Bioprofiler: Provides chemical descriptors by profiling PubChem bioactivity results for chemicals of interest, once experimental data gaps are filled using machine-learning models built from key assays.
- Database: Download and visualize curated toxicological datasets. The integrated database includes over 50,000 chemicals across 50 endpoints, mostly related to toxicity, compiled from various sources.
- Cheminformatics: Create QSAR models using either user-uploaded datasets or datasets retrieved from PubChem by providing an Assay ID. A variety of molecular descriptors and machine learning algorithms are supported. Predict toxicity for new chemicals using the models developed. Options for chemical curation and space visualization are also provided.
Bioprofiler
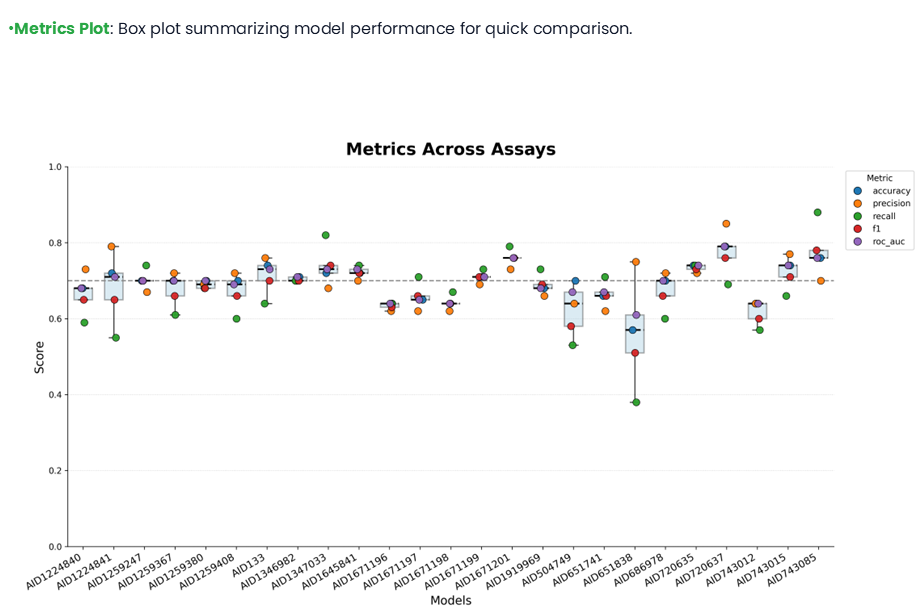
Users can upload up to 500 chemicals to profile them using PubChem bioactivity data. Bioprofiler provides chemical descriptors by profiling PubChem bioactivity results for chemicals of interest, once experimental data gaps are filled using machine-learning models built from all 35 key assays if they have at least 100 active and 100 inactive chemicals.
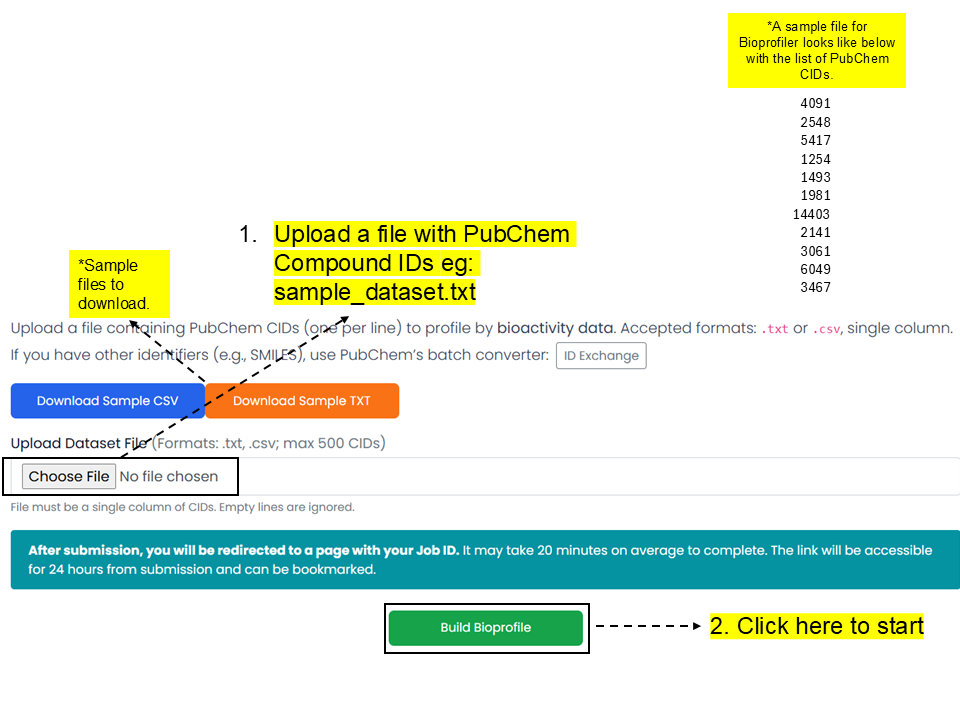
Bioprofile_sample_dataset.txt, and click the 'Build Bioprofile' button.A sample file for Bioprofiler contains one PubChem CID per line:
4091
2548
5417
1254
1493
1981
14403
2141
3061
6049
3467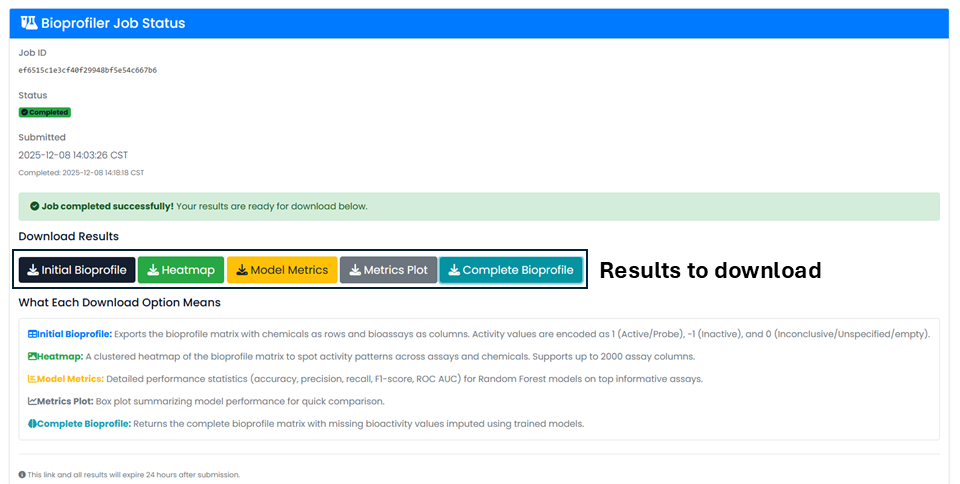
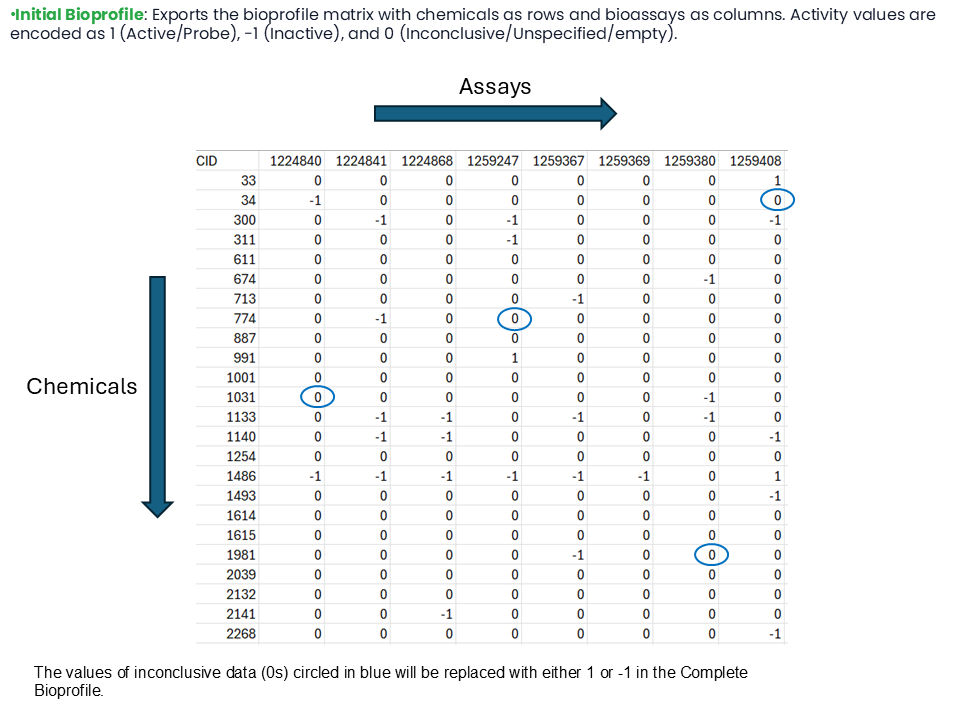
The values of inconclusive data, shown as 0s in the Initial Bioprofile, are replaced with either 1 or -1 in the Complete Bioprofile.
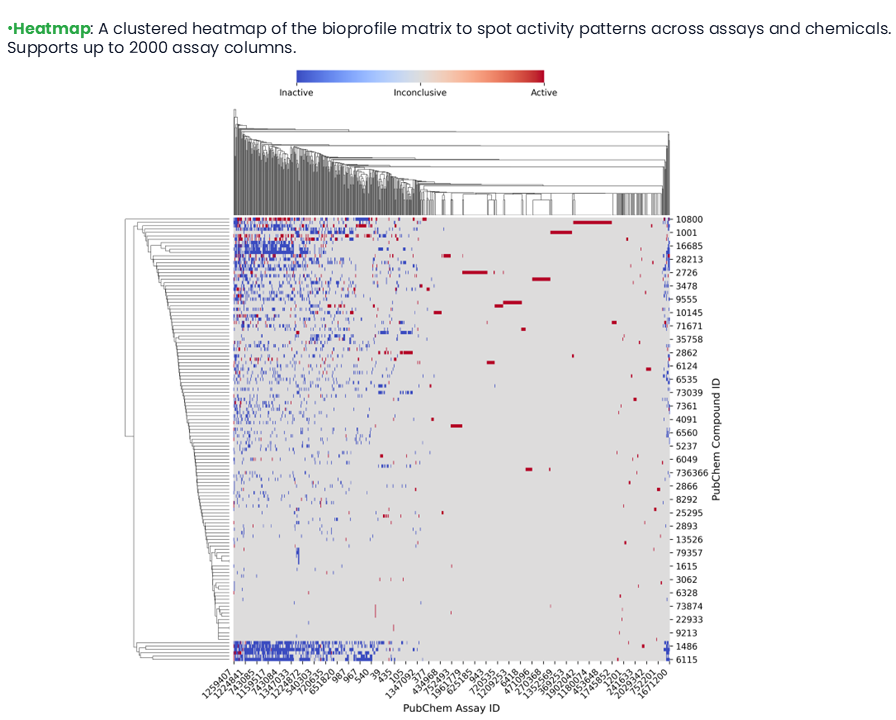
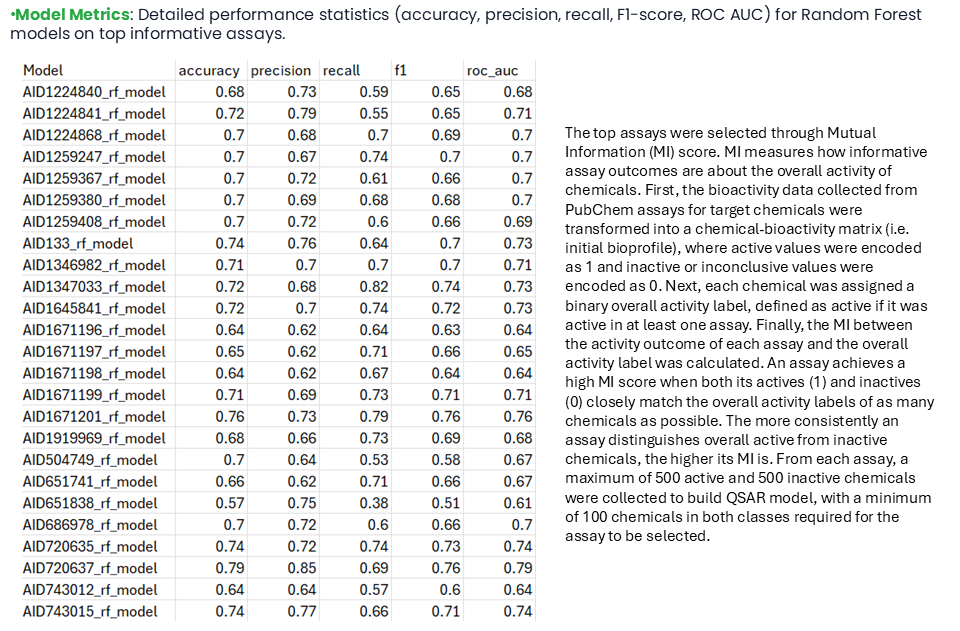
The top assays were selected through Mutual Information (MI) score. MI measures how informative assay outcomes are about the overall activity of chemicals. First, the bioactivity data collected from PubChem assays for target chemicals were transformed into a chemical-bioactivity matrix, the Initial Bioprofile, where active values were encoded as 1 and inactive or inconclusive values were encoded as 0. Next, each chemical was assigned a binary overall activity label, defined as active if it was active in at least one assay. Finally, the MI between the activity outcome of each assay and the overall activity label was calculated.
An assay achieves a high MI score when both its actives and inactives closely match the overall activity labels of as many chemicals as possible. The more consistently an assay distinguishes overall active from inactive chemicals, the higher its MI is. From each assay, a maximum of 500 active and 500 inactive chemicals were collected to build a QSAR model, with a minimum of 100 chemicals in both classes required for the assay to be selected.
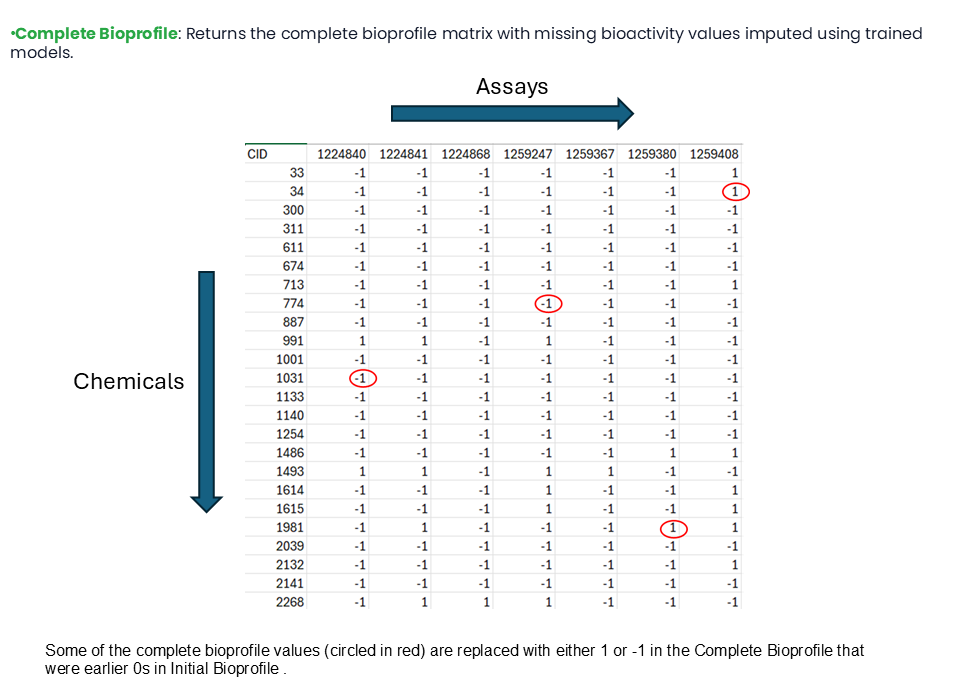
Some of the Complete Bioprofile values are replaced with either 1 or -1 if they were earlier 0s in the Initial Bioprofile.
Database
Toxicity Datasets
The Toxicity Datasets option allows users to download and visualize curated toxicological datasets, including chemical space based on structural principal component analysis and endpoint data distributions, and provides relevant bioassays from PubChem for the selected endpoints. The dataset contains over 50,000 chemical records across 50 endpoints mainly related to toxicity, collected from various sources.
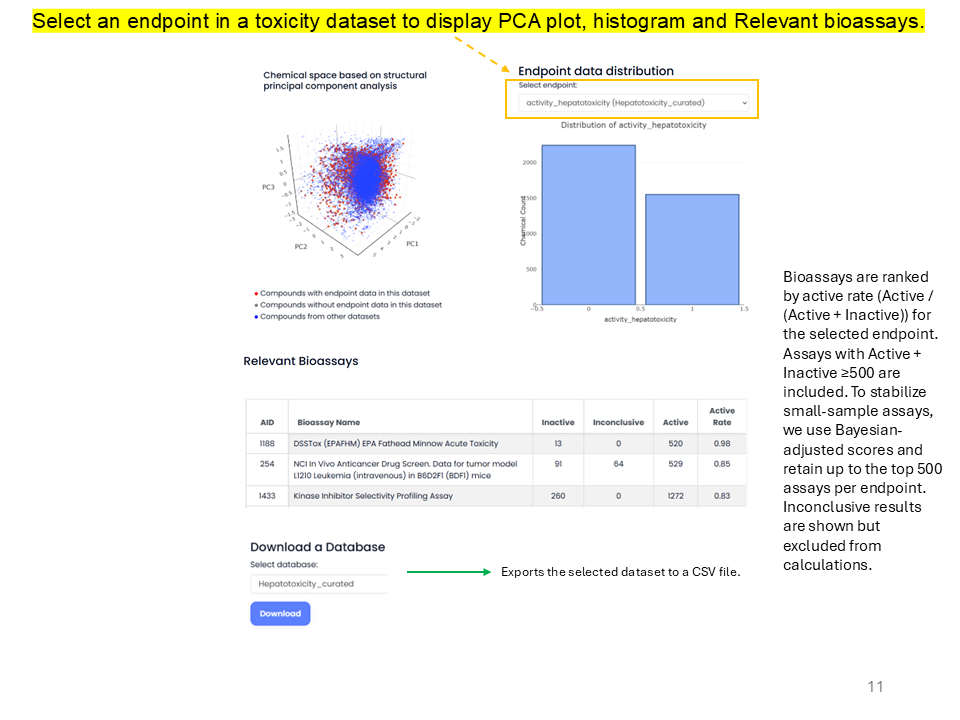
Bioassays are ranked by active rate, calculated as Active divided by Active plus Inactive, for the selected endpoint. Assays with Active + Inactive ≥500 are included. To stabilize small-sample assays, Bayesian-adjusted scores are used and up to the top 500 assays per endpoint are retained. Inconclusive results are shown but excluded from calculations.
Resources
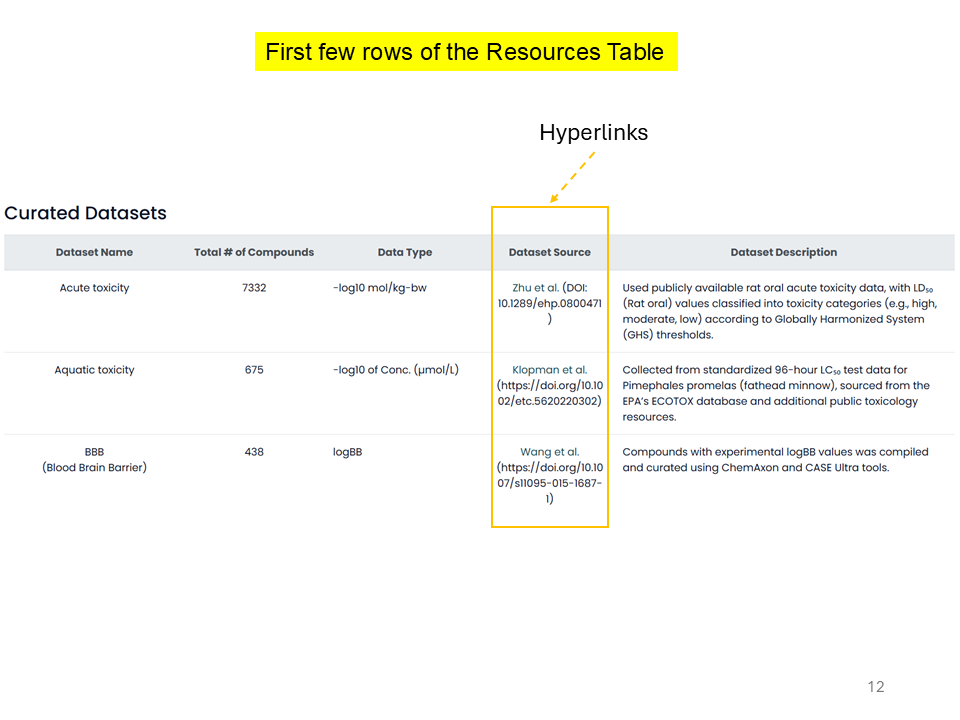
The Resources option provides details of the available datasets, including references.
Cheminformatics
The Cheminformatics module supports uploading or retrieving datasets, curation, chemical space visualization, QSAR model building, and QSAR prediction.
- Upload or Retrieve dataset
- Curator
- Chemical Space Visualization
- QSAR Builder
- QSAR Predictor
Upload or Retrieve dataset
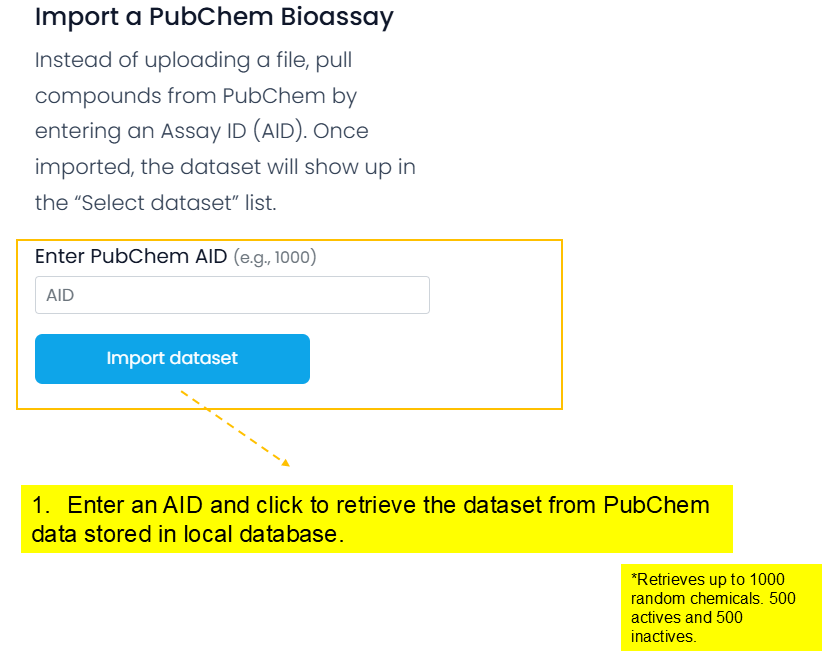
Data can be in Comma-Separated Values (CSV) or Structure Data Format (SDF) format to upload. Sample files are provided. You can upload up to 2000 chemicals or retrieve up to 1000 chemicals. Instead of uploading a dataset, you may also import chemicals with structure-activity information from PubChem by entering the PubChem Assay Identifier (AID).
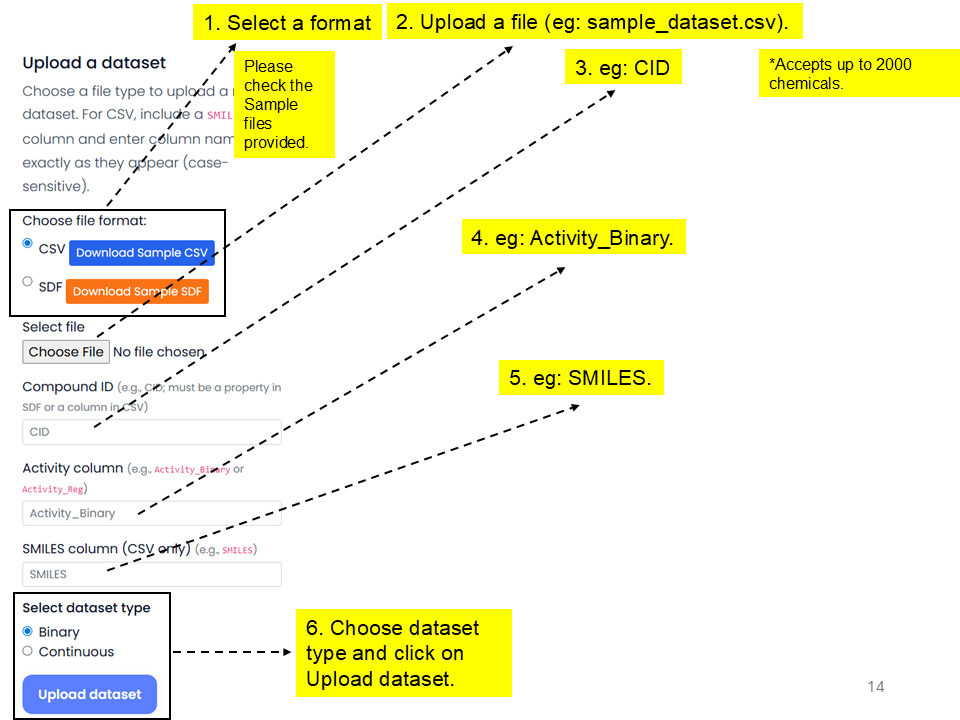
sample_dataset.csv, enter the CID, activity, and SMILES column names, choose the dataset type, and click Upload dataset.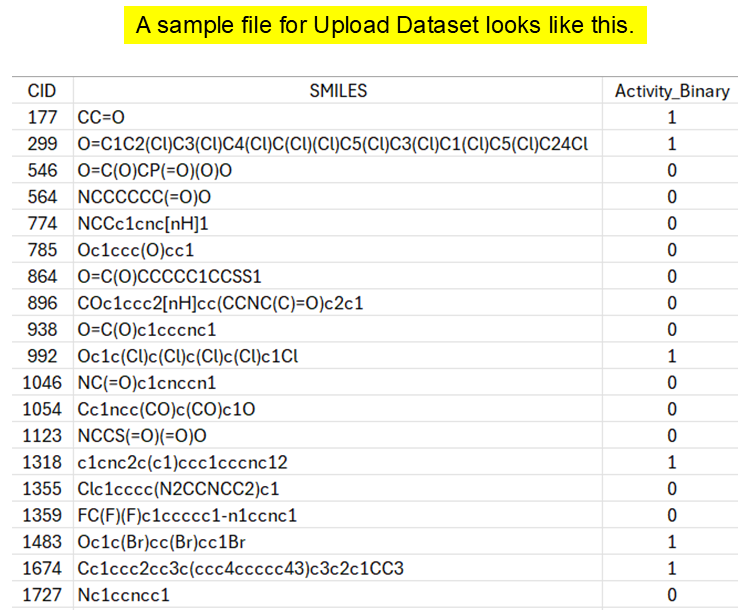
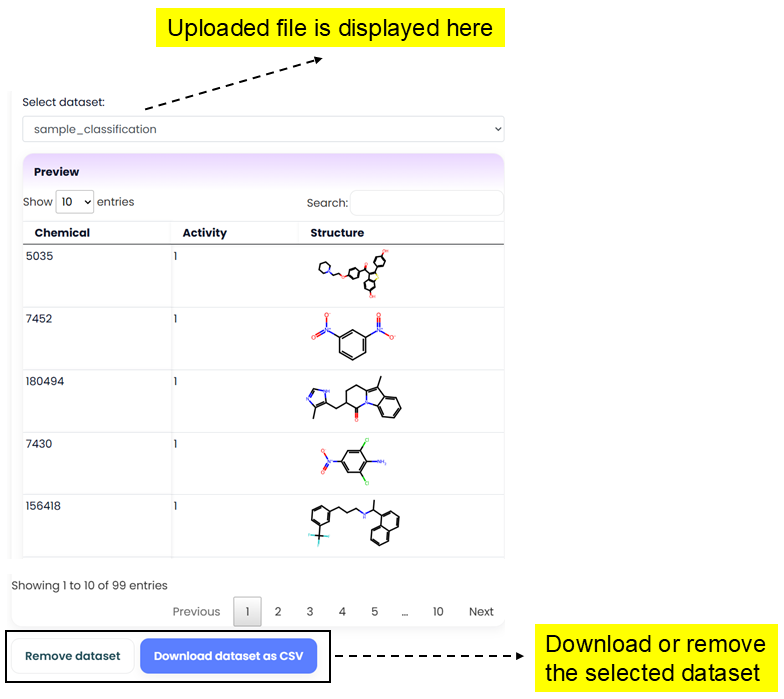
Curator
Curator cleans chemical structures and prepares them for next steps such as model generation by the following steps:
- Check and clean chemical structures.
- Standardize chemical structure representation, such as updating valencies and removing charges.
- Strip salts and solvents, and remove mixtures by retaining the parent non-salt/non-solvent component.
- Merge or remove duplicated structures.
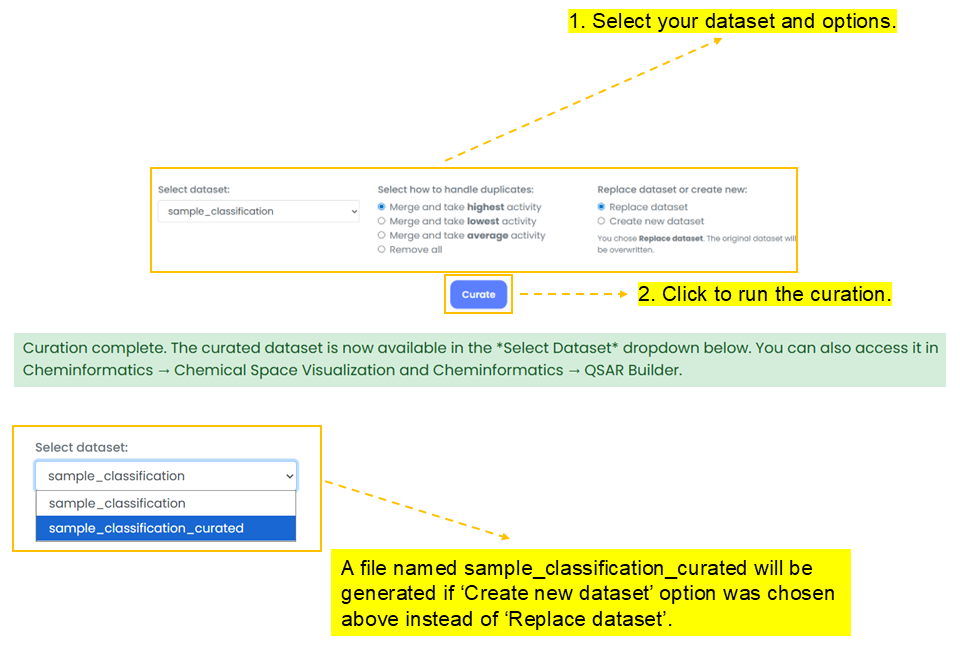
sample_classification_curated will be generated.Chemical Space Visualization
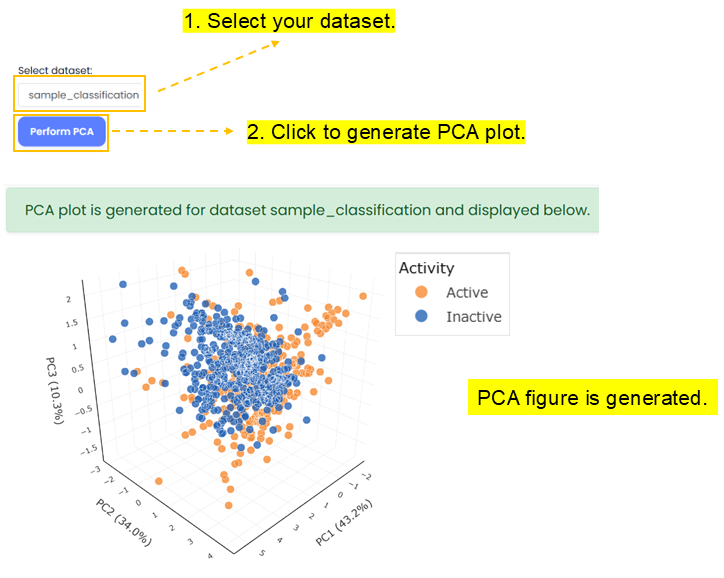
Principal Component Analysis (PCA) is a dimension reduction technique used for visualizing chemical space.
QSAR Builder
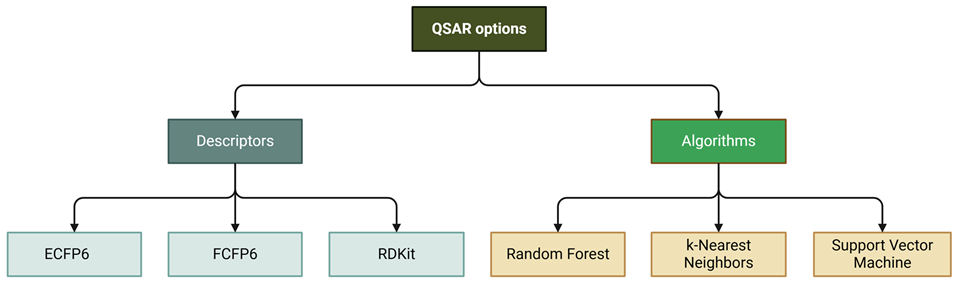
QSAR Builder creates QSAR models using a variety of descriptors and algorithms with either a user-uploaded dataset or a dataset obtained by providing a PubChem Assay ID.
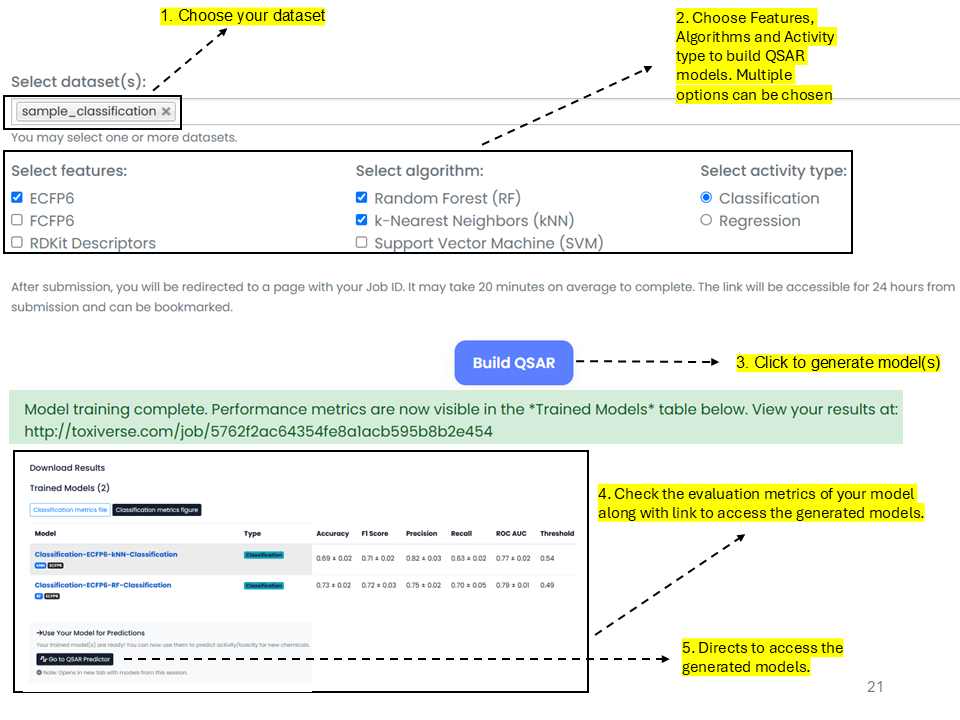
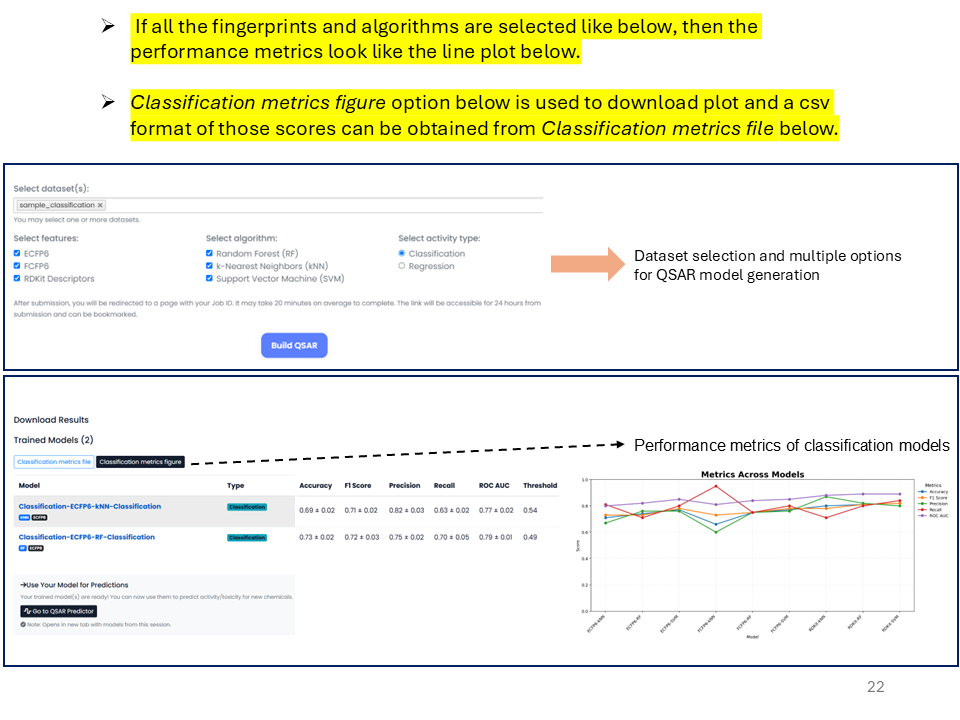
If all fingerprints and algorithms are selected, the performance metrics are shown as a line plot as above. The Classification metrics figure option is used to download the plot, and a CSV format of those scores can be obtained from the Classification metrics file.
Tasks
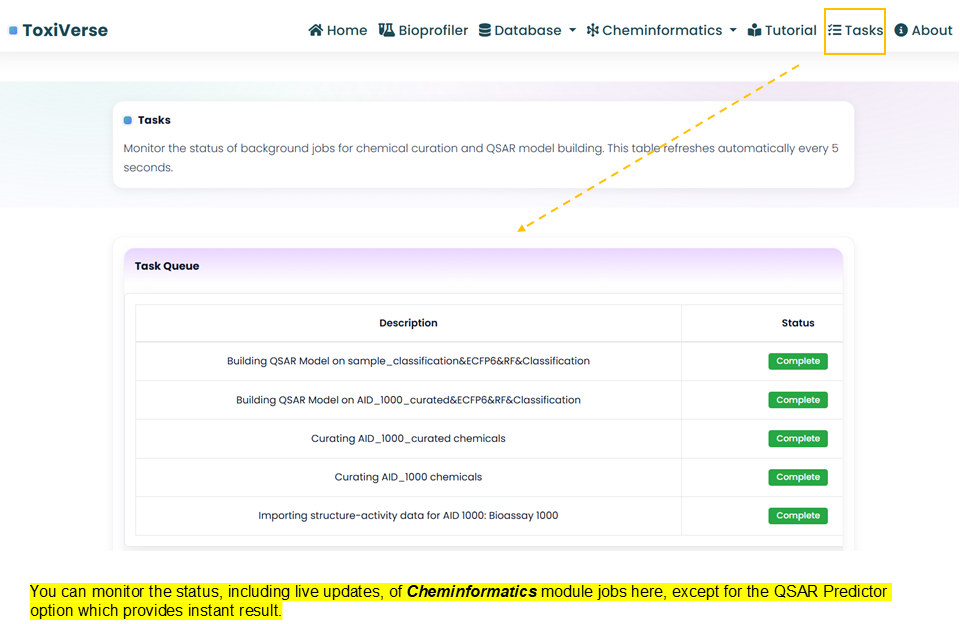
You can monitor the status, including live updates, of Cheminformatics module jobs here.
QSAR Predictor
QSAR Predictor predicts toxicity for new chemicals using models developed in the QSAR Builder option.
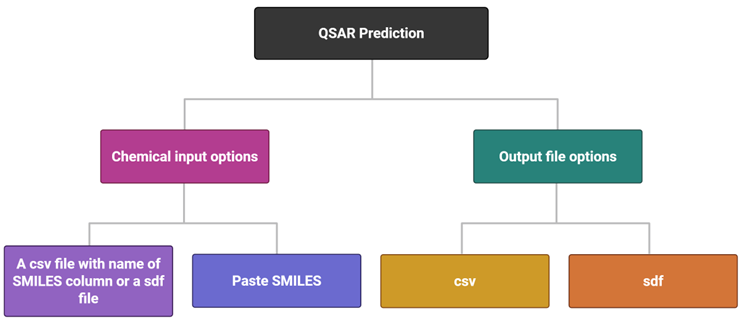
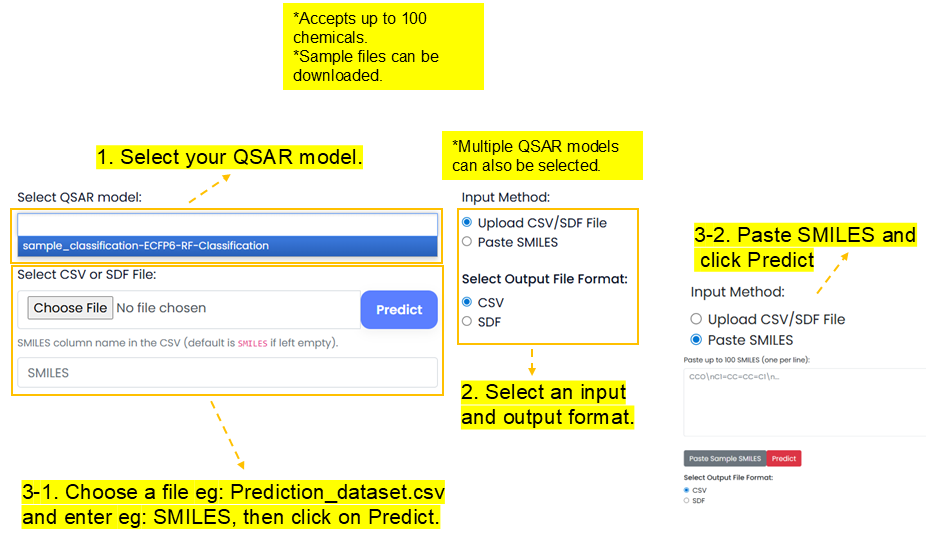
prediction_sample_dataset.csv and enter the SMILES column name, or paste SMILES and click Predict.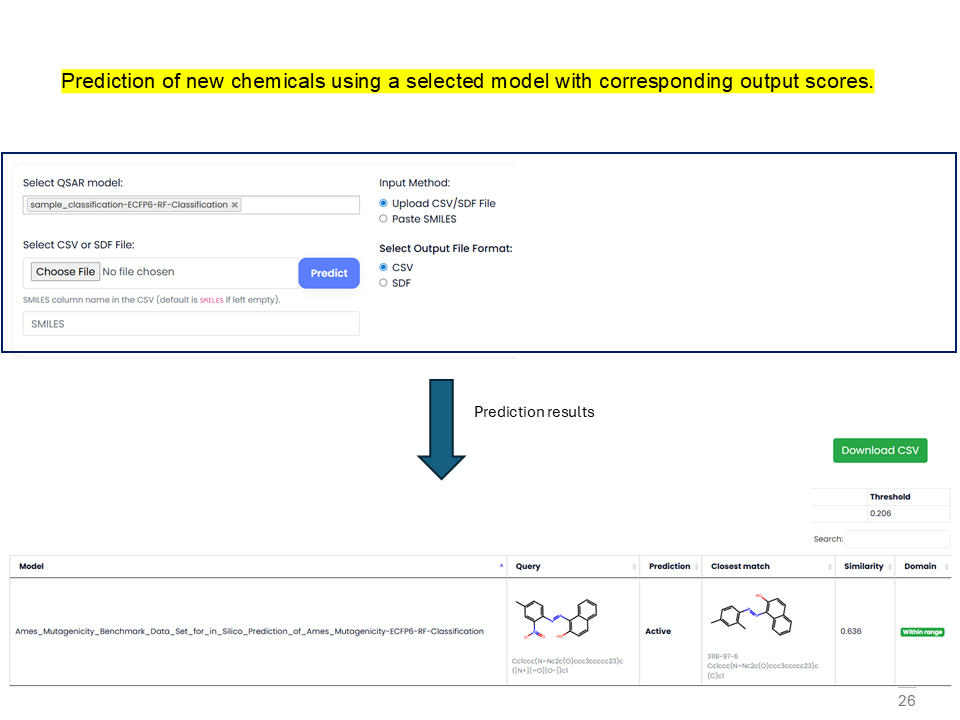
_Prediction added to the model name. The output includes prediction scores for the chemicals.
An output file such as prediction_sample_dataset_predicted.csv is downloaded with a new prediction column, for example sample_dataset_Binary-ECFP6-RF-Classification, containing predicted scores for the chemicals.
Contact us
Rowan University: 201 Mullica Hill Rd, Robinson Hall, Glassboro, NJ 08028
Tulane University: Hutchinson Memorial Building, School of Medicine, 1415 Tulane Ave, New Orleans, LA 70112
Questions, comments, and general inquiries can be emailed to toxiverse.help@gmail.com.
About us
The Zhu Lab uses cheminformatics algorithms, workflows, and other computational tools to model chemical toxicity, ADME (Absorption, Distribution, Metabolism, and Excretion), and other biological activities. These models support regulatory chemical toxicity assessments and the computer-aided drug discovery (CADD) process.